tradingview上面有一个超级趋势策略,截止到今天的获赞数量42483.
一看就是 抢手货色,我也用了很久,我们来看看这个超级趋势策略的表现:

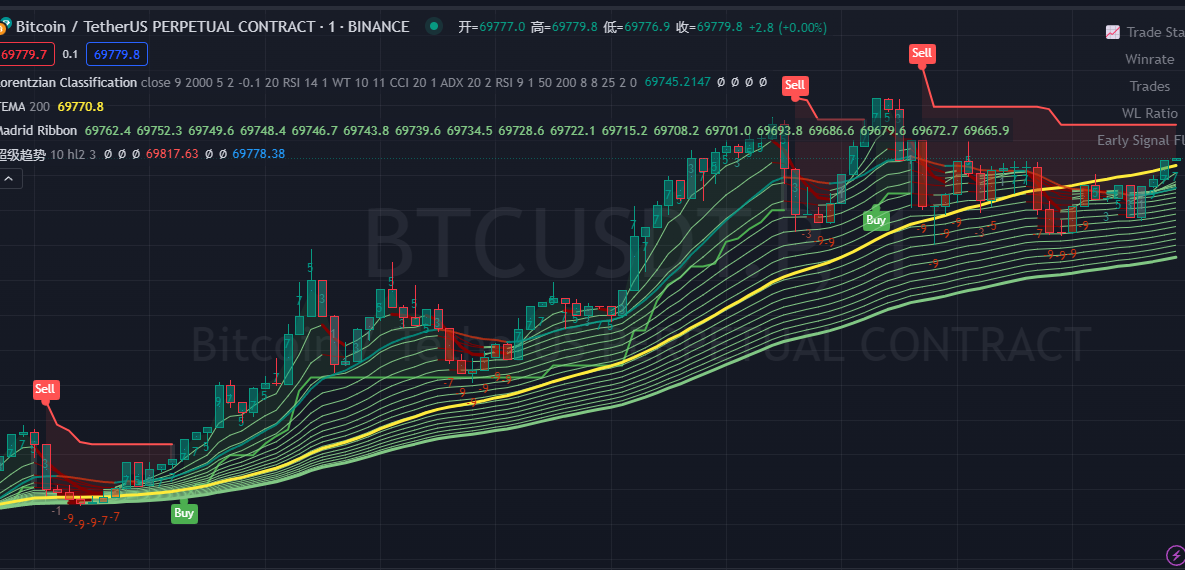
我们可以基本清晰的看到这个超级趋势策略出来的信号相对及时. 但由于指标的滞后性,我把它放到自己的框架里去接收交易信号的时候还是有一些困惑.
1.单从买卖信号来看,回测看的数据目前没有特别明显的赚钱效应. 2.这个超级趋势策略里面有一个信号转折点. 这个转折点我到现在还没搞清楚派啥用场,经常让我在交易信号过滤的时候搞不清楚,干扰了我的正常过滤规则.
之前的的信号过滤规则是如果相同的标的,在相同周期内,连续两个交易信号都是相同方向的,那么最近的相同方向的信号就过滤掉不管它.
现在这个信号转折点一来,我有点懵逼...

下面是supertrend的超级趋势 指标的源代码,大家空了收藏一下,我有时间给它换成python的...
`//@version=4 study("Supertrend", overlay = true, format=format.price, precision=2, resolution="")
Periods = input(title="ATR Period", type=input.integer, defval=10) src = input(hl2, title="Source") Multiplier = input(title="ATR Multiplier", type=input.float, step=0.1, defval=3.0) changeATR= input(title="Change ATR Calculation Method ?", type=input.bool, defval=true) showsignals = input(title="Show Buy/Sell Signals ?", type=input.bool, defval=true) highlighting = input(title="Highlighter On/Off ?", type=input.bool, defval=true) atr2 = sma(tr, Periods) atr= changeATR ? atr(Periods) : atr2 up=src-(Multiplieratr) up1 = nz(up[1],up) up := close[1] > up1 ? max(up,up1) : up dn=src+(Multiplieratr) dn1 = nz(dn[1], dn) dn := close[1] < dn1 ? min(dn, dn1) : dn trend = 1 trend := nz(trend[1], trend) trend := trend == -1 and close > dn1 ? 1 : trend == 1 and close < up1 ? -1 : trend upPlot = plot(trend == 1 ? up : na, title="Up Trend", style=plot.style_linebr, linewidth=2, color=color.green) buySignal = trend == 1 and trend[1] == -1 plotshape(buySignal ? up : na, title="UpTrend Begins", location=location.absolute, style=shape.circle, size=size.tiny, color=color.green, transp=0) plotshape(buySignal and showsignals ? up : na, title="Buy", text="Buy", location=location.absolute, style=shape.labelup, size=size.tiny, color=color.green, textcolor=color.white, transp=0) dnPlot = plot(trend == 1 ? na : dn, title="Down Trend", style=plot.style_linebr, linewidth=2, color=color.red) sellSignal = trend == -1 and trend[1] == 1 plotshape(sellSignal ? dn : na, title="DownTrend Begins", location=location.absolute, style=shape.circle, size=size.tiny, color=color.red, transp=0) plotshape(sellSignal and showsignals ? dn : na, title="Sell", text="Sell", location=location.absolute, style=shape.labeldown, size=size.tiny, color=color.red, textcolor=color.white, transp=0) mPlot = plot(ohlc4, title="", style=plot.style_circles, linewidth=0) longFillColor = highlighting ? (trend == 1 ? color.green : color.white) : color.white shortFillColor = highlighting ? (trend == -1 ? color.red : color.white) : color.white fill(mPlot, upPlot, title="UpTrend Highligter", color=longFillColor) fill(mPlot, dnPlot, title="DownTrend Highligter", color=shortFillColor) alertcondition(buySignal, title="SuperTrend Buy", message="SuperTrend Buy!") alertcondition(sellSignal, title="SuperTrend Sell", message="SuperTrend Sell!") changeCond = trend != trend[1] alertcondition(changeCond, title="SuperTrend Direction Change", message="SuperTrend has changed direction!") `